Deep Dive: Understanding the Aya Project Structure
TL;DR
The main goal of this blog is to explain the project structure generated by the Aya template, which is used to write eBPF programs in Rust.
You might wonder why this blog is needed when Aya already has good documentation. This post is meant to be an extension of the official Aya documentation.
This blog does not cover basic eBPF concepts or beginner Rust examples. It assumes you already know:
- what eBPF is
- how to write basic eBPF programs in Rust
- how Aya is used at a high level
This post focuses only on how an Aya project is structured and why it is structured that way.
Getting Started
If you want a general introduction to Aya and how it works, refer to the official documentation
For installation steps, follow the guide here.
In this blog, we will skip those basics and focus directly on the project structure.
Aya Project Template
We will use the official Aya template to understand the project layout.
The template is available here:
aya-template
You can generate a new project using the following command:
cargo generate --name ebpf https://github.com/aya-rs/aya-template
Running this command locally generates a project named xdp and prompts you to choose a program type. It gives options which are shown below:
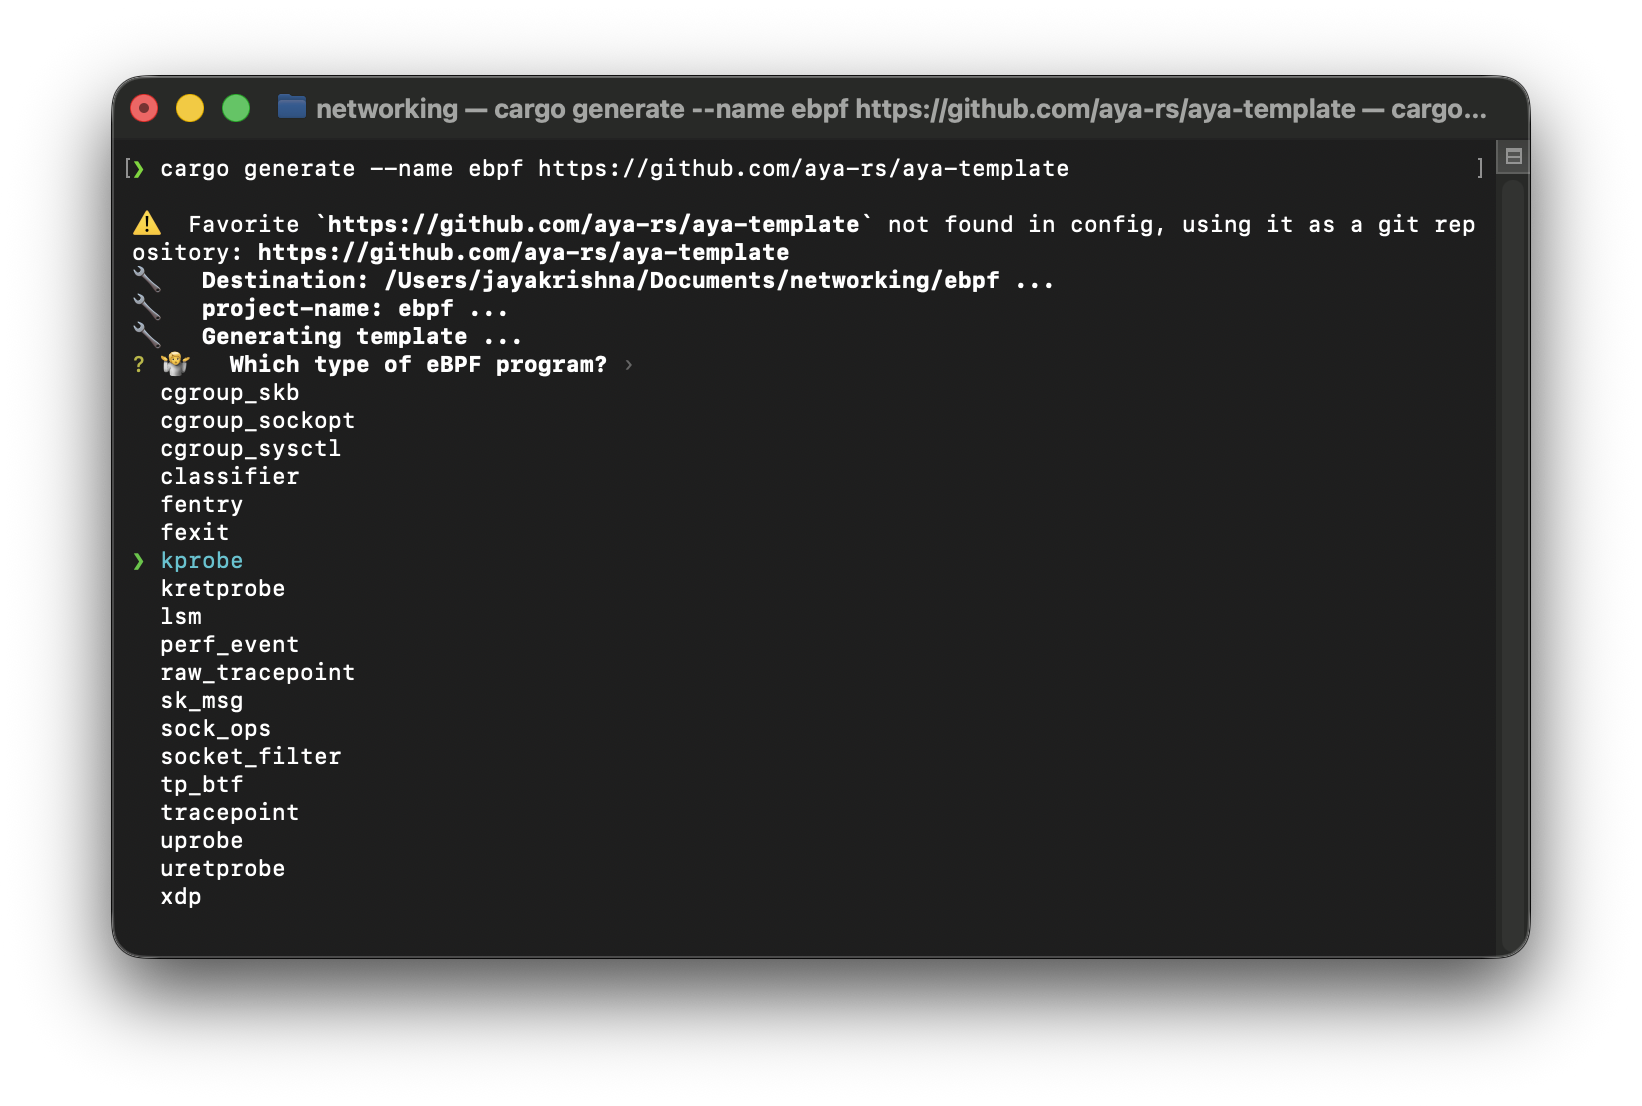
these are all the options which we can use when creating a new project with the aya-template.
now i'll explain about few program types which we can use,
Note: This section may feel a bit heavy at first. Just skim through these program types to get a high-level idea.
xdp -> eXpress data path
This program attaches to a network interface (for example, eth0) and hooks into incoming network packets.
XDP programs run as soon as a packet hits the NIC, before the kernel networking stack. They are used for high-performance networking tasks like firewalls, DDoS protection, and load balancing.
Think of it as -> "A packet arrives - should I DROP it, PASS it, or REDIRECT it?"
kprobe
This program attaches to a kernel function, for example execve or do_sys_openat2, and hooks into the function entry point.
kprobes let you run eBPF code whenever a specific kernel function is executed. They are commonly used for tracing, observability, and security monitoring.
Think of it as -> "kernel just entered this function, so observe it."
perf_event
A perf_event eBPF program is attaches to performance monitoring events provided by the Linux perf subsystem. These events can be CPU cycles, Instructions executed, Cache misses, Page faults, and more.
These are not triggered when something happened it triggers on time/ count/ threshold reached etc.
Think of this as -> "Every N CPU cycles, run this eBPF program."
kretprobe
This program attaches to the same kernel function as kprobe, but hooks into the function return point.
kretprobes run when a kernel function finishes execution. They are commonly used to measure latency or inspect return values.
Think of it as -> "kernel just exited this function."
tracepoint
This program attaches to stable tracepoint names like syscalls:sys_enter_execve and syscalls:sys_exit_execve, and hooks into predefined kernel events.
Tracepoints are safer and more stable than kprobes because the kernel explicitly exposes them. Many production observability tools prefer tracepoints.
Think of it as -> "kernel just exposed this event, so listen to it."
fentry/fexit
This program attaches to kernel functions that have BTF information and hooks into function entry or exit based on BTF.
These are modern replacements for kprobe and kretprobe. They are faster, safer, and more stable across kernel versions.
Think of it as -> "kernel just entered/exited this function."
uprobe
This program attaches to user-space binaries and function symbols and hooks into user-space function entry.
uprobes allow eBPF programs to observe user-space applications, not just the kernel. They are useful for tracing application behavior without changing application code.
Think of it as -> "A user program just called this function."
uretprobe
This program attaches to the same place as uprobe but hooks into the user-space function return point.
It is mainly used to measure latency or capture return values from user-space functions.
These program types cover most real-world use cases. They are also more stable and safer than older alternatives.
so now let's see the structure of the project which we get from the cargo generate command.
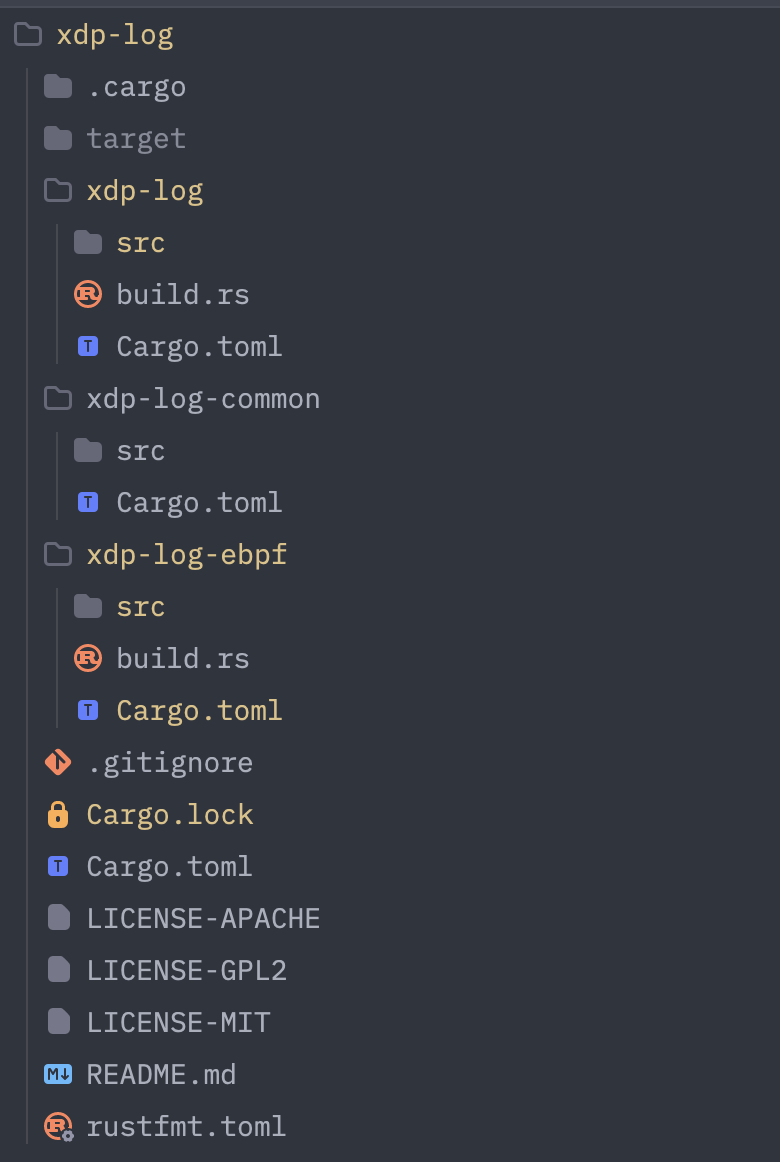
here in this project xdp-log we have three folders and all the important files at same level.
xdp-log— User-space program that loads and manages eBPF programsxdp-log-ebpf— Kernel-space eBPF programsxdp-log-common— Shared types used by both user space and kernel space
If you are on macOS and want to run XDP programs, you can refer to this post: XDP on macOS using Lima