Learning eBPF - Chapter 2: How to write eBPF programs
TL;DR
If you’re new to eBPF, I recommend reading the previous post Learning eBPF - Chapter-1 to understand what eBPF is and why it matters.
In this chapter, we focus on writing eBPF programs. While the book uses C and Python, I implement the same examples using Rust with the Aya library.
If you want to understand the Aya project structure, such as where kernel code and user-space code live, you can refer to my blog Deep Dive into Aya project structure
Getting Started
Now let’s start by writing a basic eBPF program — the traditional “Hello World.”
In every programming journey, Hello World is the first ritual, so we’ll begin our eBPF journey the same way.
#[kprobe]
pub fn hello(ctx: ProbeContext) -> u32 {
    info!(&ctx, "Hello World!");
    0
}

let program: &mut KProbe = ebpf.program_mut("hello").unwrap().try_into()?;
program.load()?;
program.attach("execve", 0)?; // if we don't attach to any function, this will never be triggered
The code we have here has two different parts: the eBPF program itself that will run in the kernel and some user space code where we load that program into the kernel and reads out the trace that it generates.
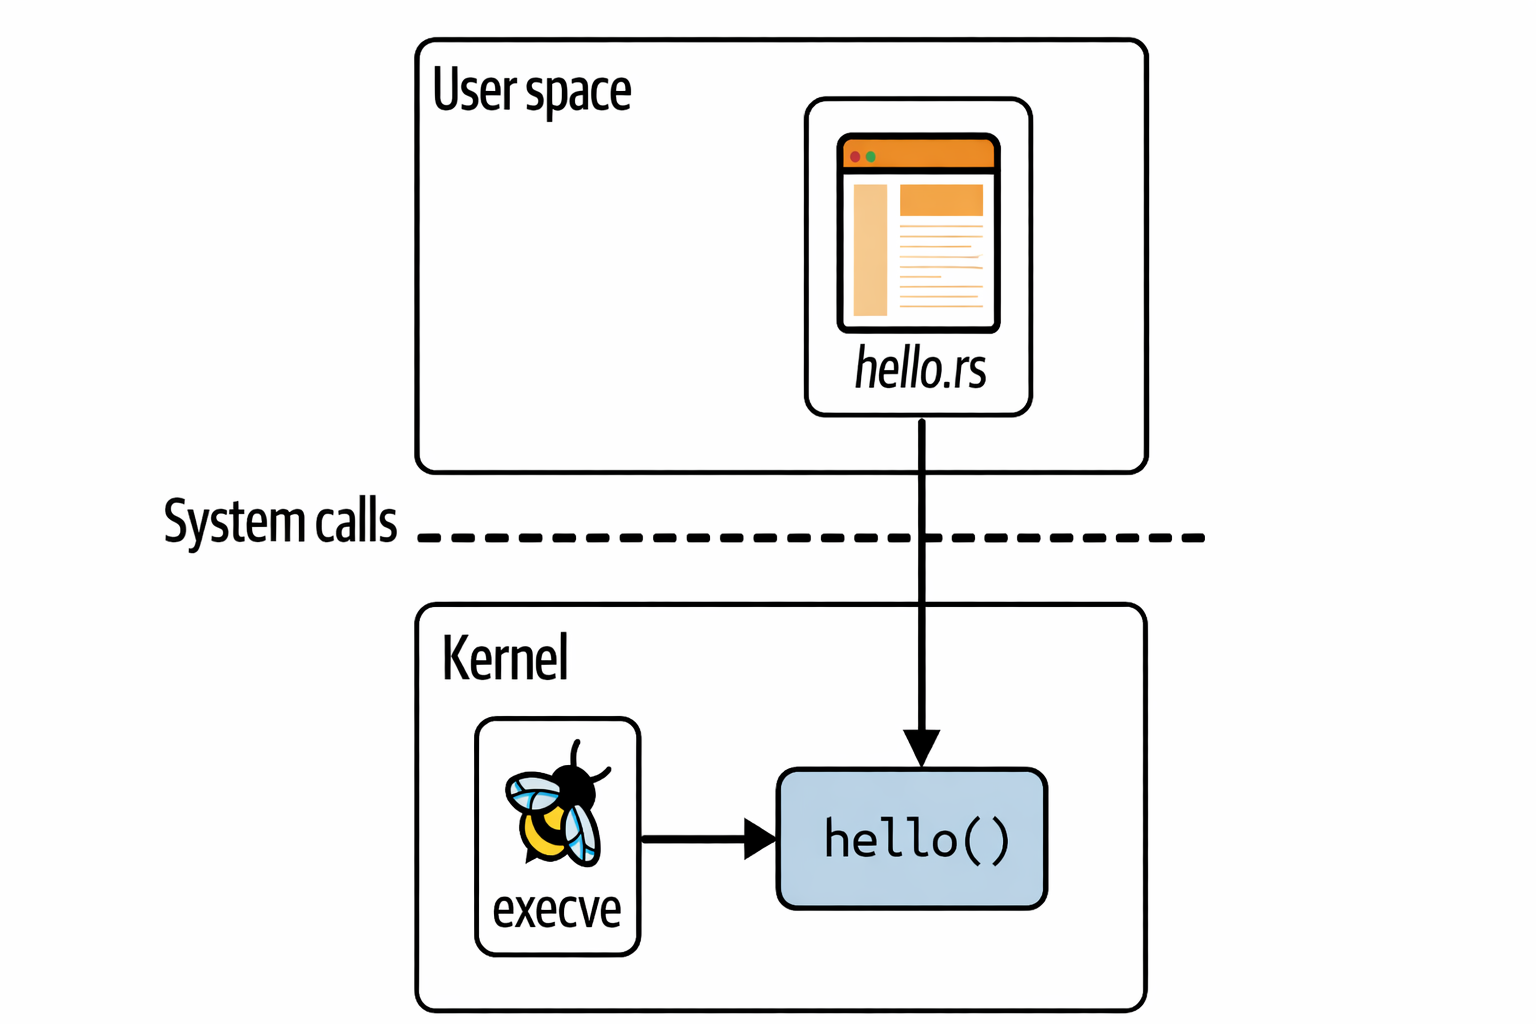 as you see in the above image the rust code is the user space part and hello() is the eBPF program that runs in the kernel
so now let's go through the each line of the source code to understand it better
here we have a kprobe function called hello(). #[kprobe] is the macro that tells to the compiler that this function is an eBPF program that will run in the kernel with the program type kprobe.
in this info() is a helper function that prints the message to the kernel log, which is similar to the bpf_trace_printk() function which is shown in the book itself to print the message to the kernel log.
when we compare both the functions, info() and bpf_trace_printk(), we can see that they are similar in functionality.
This entire eBPF program is defined as a string called program. In any language whether it is C or Rust, the eBPF program needs to be compiled into bytecode before it can be loaded or executed.
As it is a string we provide to the function name in the form of a string.
let program : &mut kprobe = ebpf.program_mut("hello").unwrap().try_into()?;
// Based on the kernel function we have the string changes
program.load()?;
and program.load()?; will load the eBPF program bytecode into the kernel.
Every eBPF program needs to be attached to an event. If you see our example we have attached our program to the system call execve, it works whenever anything or anyone starts a new program executing on this machine, that will call execve, this will trigger the eBPF program.
The code for attaching the program to the event is as follows:
program.attach("execve",0)?; // if we don't attach to any function this will never triggered to execute
Check the following execution illustration:
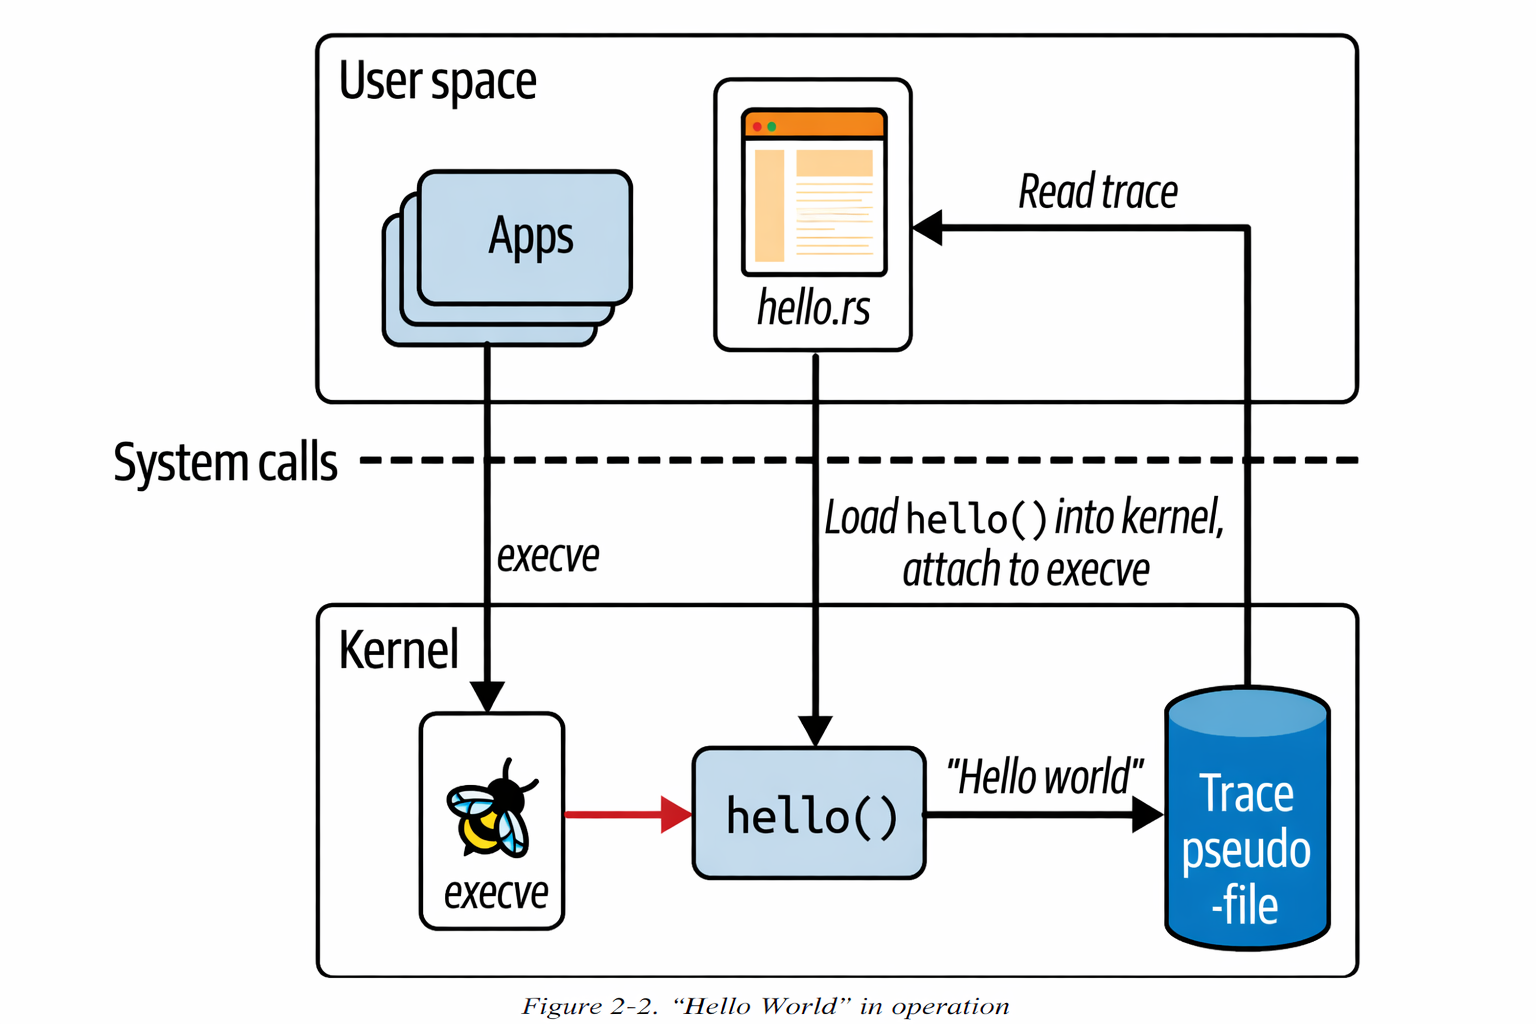
As soon as the hello eBPF program is loaded and attached to an event, it gets triggered by events that are being generated from pre-existing processes. So here there are few points from chapter-1
-
• eBPF programs can be used to change the behaviour of the kernel dynamically. There's no need to reboot the system to apply the changes. eBPF code starts taking effect as soon as it is attached to an event.
-
• There’s no need to change anything about other applications for them to be visible to eBPF. Wherever you have terminal access on that machine, if you run an executable in it, that will use the
execve()syscall, and if you have thehelloprogram attached to that syscall, it will be triggered to generate tracing output. Likewise, if you have a script that runs executables, that will also trigger thehelloeBPF program. You don’t need to change anything about the terminal’s shell, the script, or the executables you’re running.
BPF Maps
A map is a data structure that can be accessed from an eBPF program and from the user space. Maps are one of the really significant features that distinguishes extended BPF from it's classic predecessor.
Maps can be used to share data among multiple eBPF programs or to communicate between a user space application and eBPF code running in the kernel. The typical uses includes:
- • User space writing configuration information to be retrived by an eBPF program.
- • An eBPF program storing state, for later retrieval by another eBPF program.
- • An eBPF program writing results or metrics into a map, for retrieval by the user space app that will present results like packet count, syscall count, latency histogram etc.
so the core idea of this is
User Space  <------ shared ------>  Kernel (eBPF)
                BPF MAP
There are various types of Bpf maps defined in Linux and there also some info about them in kernel docs.
In general these all are key-value stores and from here on you'll see examples of maps for hash tables, perf and fing buffers and arrays of eBPF programs.
Some map types are defined as arrays, which has 4-byte index as the key type; other maps are hash tables that can use some arbitrary data type as the key.
There are so many map types that are optimised for particular types of operations, such as:
- first-in-first-out-queues
- first-in-last-out-stacks
- last-recently-used data storage
- longest-prefix-matching
- Bloom filters
some eBPF maps holds information about specific types of objects like socketmaps and devmaps, These hold information about sockets and network devices are used by network-related eBPF programs.
There are even a map-of-maps to support storing information about maps.
Hash Table Map
Like previous this example eBPF program will be attached to a kprobe at the entry to the execve system call. it's going to populate the hash table with the key-value pairs, where the key is a user ID and the value is a counter for the number of times the user called the execve system call.
The kernel side code will look like this:
// 1
#[map(name = "COUNTER_TABLE")]
static mut COUNTER_TABLE: HashMap<u32, u64> =
    HashMap::<u32, u64>::with_max_entries(1024, 0);

#[kprobe]
pub fn hello(ctx: ProbeContext) -> u32 {
    unsafe {
        // 2
        let uid = (bpf_get_current_uid_gid() & 0xFFFFFFFF) as u32;

        // 3
        let map = &mut *core::ptr::addr_of_mut!(COUNTER_TABLE);

        // 4
        let counter = match map.get_ptr(&uid) {
            Some(ptr) => core::ptr::read(ptr),
            None => 0,
        };

        // 5
        let _ = map.insert(&uid, &(counter + 1), 0);
    }
    0
}
Here i have pointed important lines in the code so now let's discuss each of them:
1 -> this is the line where we declared the COUNTER_TABLE using HashMap from aya library and map macro, This #[map] attribute tells to the kernel that this is a hash map and it should be created as a kernel object.
2 -> This is where we get the current user ID using the bpf_get_current_uid_gid() function. In here 0xFFFFFFFF is used to mask the upper 32 bits of the UID, which are not used in the kernel. The left out lower 32 bits of the UID are stored in the uid variable.
3 -> Here we are using the raw pointer to get the counter table value from the hash map.
NOTE: There is a reason we are using raw pointers in here, because in
rustwe can't create a shareable reference of a mutableSTATICvariable as it is a global variable it may also accessed by other loop or thread anything, so we are using raw pointer to get the value from theSTATICvariable.
4 -> In here we are checking if the counter for the current user ID exists or not in the hash-map if it is not then we are getting that value in the counter and if it is present then we are returning 0
5 -> Here we are finally inserting the uid and counter value with increment as it is 0 when it is not present in the hash map.
These are all the important lines from the kernel side i hope you understood.
Now if we see the user space code it looks more like the previous example loading and attaching all are similar to that. The only addition to that is we are going to map load from the user space and use that. The code looks like:-
// 1
let program : &mut KProbe =  ebpf.program_mut("hello").unwrap().try_into()?;
program.load()?;
program.attach("execve",0)?;

// 2
let map = ebpf
    .map_mut("COUNTER_TABLE")
    .context("failed to get the counte table hashmap")?;

// 3
let counter_table: HashMap<&mut _, u32, u64> = HashMap::try_from(map)?;

// 4
loop {
    print!("counters");
    for result in counter_table.iter() {
        let (uid,counter) = result;
        println!("UID {}=> {}", uid, counter);
    }
    // 5
    std::thread::sleep(std::time::Duration::from_secs(2));
}
1 -> this is where we load our eBPF programs from the kernel space based on their, load them and attach them to the kernel.
2 -> Here we are loading the map from the kernel space and storing it in the map variable.
3 -> The value which we get in 2 is a map type which is a raw kernel handle so in here we convert this into a HashMap by verifying it using the HashMap::try_from function.
4 -> This is the loop where we are printing the counter by iterating over the counter_table hash-map.
5 -> Here we make the loop sleep for 2 seconds before printing the counters again. so to that we have time to add more users and see the counter increase.
Checkout this branch in here to get this code execution
Now we are done with the basic code on maps so now let's move on to the next topic in this chapter.
Perf and Ring Buffer Maps
Ring Buffer
Let’s understand what a ring buffer is.
A ring buffer is a data structure that stores data in a circular fashion and has a fixed size. Inside the ring buffer, there are two pointers: a write pointer and a read pointer.
Data of some arbitrary length is written into the ring buffer wherever the write pointer currently exists. The length of the data is stored in a header along with the data itself. After writing the data, the write pointer moves forward to the end of that data, making it ready for the next write operation.
Check this figure for better understanding:
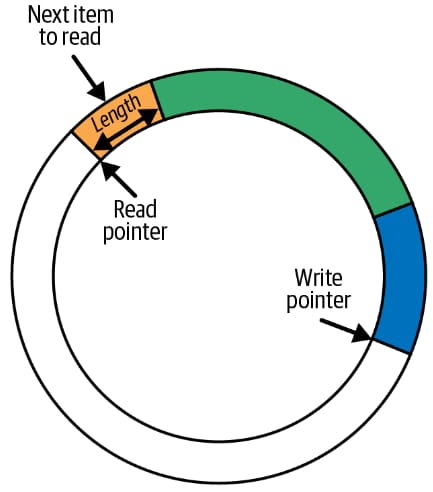
Similar to writing, the read operation also works in the same way. Data is read from wherever the read pointer currently exists. The read operation uses the data header to determine how much data to read. After reading, the read pointer moves forward in the same direction as the write pointer so that it points to the next available piece of data.
If the read pointer catches up with the write pointer, it means the ring buffer is empty and there is no data available to read. If a write operation would cause the write pointer to overtake the read pointer, the new data is not written into the ring buffer. Instead, the data is dropped and a drop counter is incremented.
Read operations also include the drop counter, which helps indicate whether any data has been lost since the last successful read. In real-world scenarios, read and write operations rarely happen at the same rate, so the ring buffer size must be carefully tuned to handle variations in data flow and reduce the chances of data loss.
let's see in action earlier we have the code which runs whenever we have execve system call made now in this we write the string Hello world to the screen everytime and syscall made and then it will also lookup the process ID and the name to command
that makes execve() syscall
now the code looks like this:
// 1
#[map]
static EVENTS: RingBuf = RingBuf::with_byte_size(4096, 0);

// 2
#[repr(C)]
pub struct Data {
    pub pid: u32,
    pub uid: u32,
    pub command: [u8; 16],
    pub message: [u8; 12],
}

#[kprobe]
pub fn hello(ctx: ProbeContext) -> u32 {
    // 3
    let mut data: Data = unsafe { core::mem::zeroed() };

    // 4
    let pid = (bpf_get_current_pid_tgid() >> 32) as u32;
    let uid = (bpf_get_current_uid_gid() & 0xFFFFFFFF) as u32;
    data.pid = pid;
    data.uid = uid;

    // 5
    let comm = bpf_get_current_comm()?;
    data.command = comm;
    // 6
    data.message.copy_from_slice(b"hello world\0");

    // 7
    if let Some(mut buf) = EVENTS.reserve::<Data>(0) {
        // 8
        buf.write(data);
        // 9
        buf.submit(0);
    }
    0
}
now here based on the points i'll explain everything in this code:
1 -> EVENTS is the RingBuf map which is used to store the data.
2 -> Data is a struct which is used to store the data which we want to send to the user space. and repr(C) macro is used to ensure that the struct is laid out in memory in a way that is compatible with C.
3 -> In here data is the variable with the type Data which is the struct we defined and it is initialized with zeroed memory.
4 -> In here we are getting the pid and uid of the current process and assigning them to the pid and uid fields of the data struct.
5 -> comm is the name of the current process which is running we are getting this by bpf_get_current_comm() helper function.
6 -> message is just a static message we are trying to add in the struct.
7 -> EVENTS.reserve::<Data>(0) is used to reserve the space in the ring buffer for the data which we want to send to the user space.
8 -> buf.write(data) is used to write the data to the ring buffer.
9 -> buf.submit(0) is used to submit the data to the user space.
Now let's move to the user space and call this kernel program there:
   // 1
   let hello: &mut KProbe = ebpf.program_mut("hello").unwrap().try_into()?;
    hello.load()?;
    hello.attach("execve", 0)?;
    // 2
    let map = ebpf
        .map_mut("EVENTS")
        .context("Failed to get the events map from the kernel")?;

    // 3
    let mut events: RingBuf<_> = RingBuf::try_from(map)?;

    // 4
    #[repr(C)]
    #[derive(Debug)]
    // 5
    struct Data {
        pid: u32,
        uid: u32,
        command: [u8; 16],
        message: [u8; 12],
    }

    loop {
        // 6
        while let Some(record) = events.next() {
            // 7
            let data = unsafe { ptr::read_unaligned(record.as_ptr() as *const Data) };
            // 8
            println!(
                "pid={} uid={} comm={} msg={}",
                data.pid,
                data.uid,
                bytes_to_str(&data.command),
                bytes_to_str(&data.message)
            )
        }
    }

// 9
pub fn bytes_to_str(bytes: &[u8]) -> String {
    let end = bytes.iter().position(|&b| b == 0).unwrap_or(bytes.len());
    String::from_utf8_lossy(&bytes[..end]).to_string()
}
Now let's go through the code line by line:
1 -> This is the same part which we already seen which is getting the kprobe program from kernel, loading it and attaching it to the kernel execve system call.
2 -> let map = ebpf.map_mut("EVENTS") is used to get the events map from the kernel and throw error context when it fails.
3 -> let mut events: RingBuf<_> = RingBuf::try_from(map)? is used to create a ring buffer from the events map.
4 -> #[repr(C)] is used to specify the layout of the struct.
5 -> Data is the struct which defines the structure of the data that is stored in the ring buffer. and this is similar to the Data struct from kernel space.
6 -> while let Some(record) = events.next() is used to iterate over the events, Which are stored in the ring buffer.
7 -> let data = unsafe { ptr::read_unaligned(record.as_ptr() as *const Data) }; is used to read the data from the ring buffer. Here we are using read_unaligned to read the data from the ring buffer, because the bytes which we get from the ring buffer are not guaranteed to be aligned.
8 -> println!("pid={} uid={} comm={} msg={}", data.pid, data.uid, bytes_to_str(&data.command), bytes_to_str(&data.message)) is used to print the data.
9 -> pub fn bytes_to_str(bytes: &[u8]) -> String is used to convert the bytes to string.
Checkout the illustration of the ring buffer execution here:
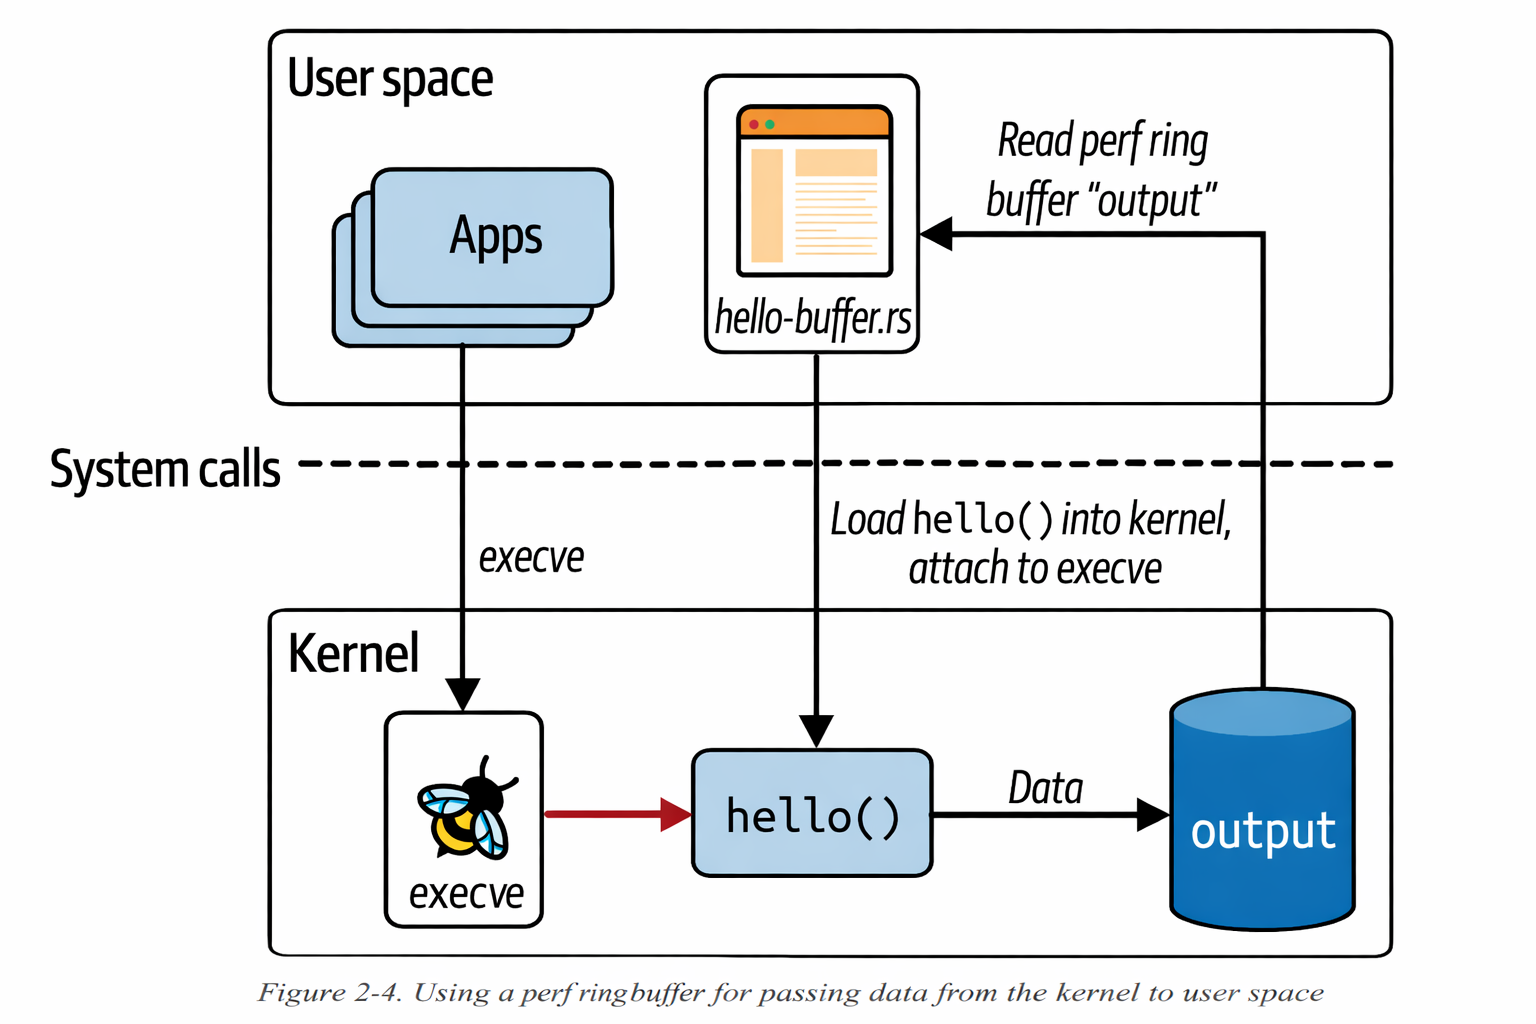
In here along with the ring buffer code example, we can see that we have bunch of helper functions which helps us to get the information about the user ID, the process ID, and the name of the current command.
The fact the contextual information like this is available in eBPF code is what makes it so powerful and valuable for observability.
Further, as we move into the chapters, there are multiple examples to show how to use eBPF for different use cases.
Function cells
In this chapter, we have used lot of helper functions which are provided by kernel. but what if you want to split the code your are writing into different functions? In development there is quote for this Don't repeat yourself. .
In earlier days kernel is not supporting the function calls. so the developers to work around this they have directed to compiler to always_inline the functions. it looks like this:
static __always_inline void my_function(void *ctx, int val)
In rust we use the attribute over the function
#[inline(always)]
fn my_function(ctx: *mut u8, val: i32) {
    // function body
}
the difference between the normal function and inline function is visually differentiated in this illustration
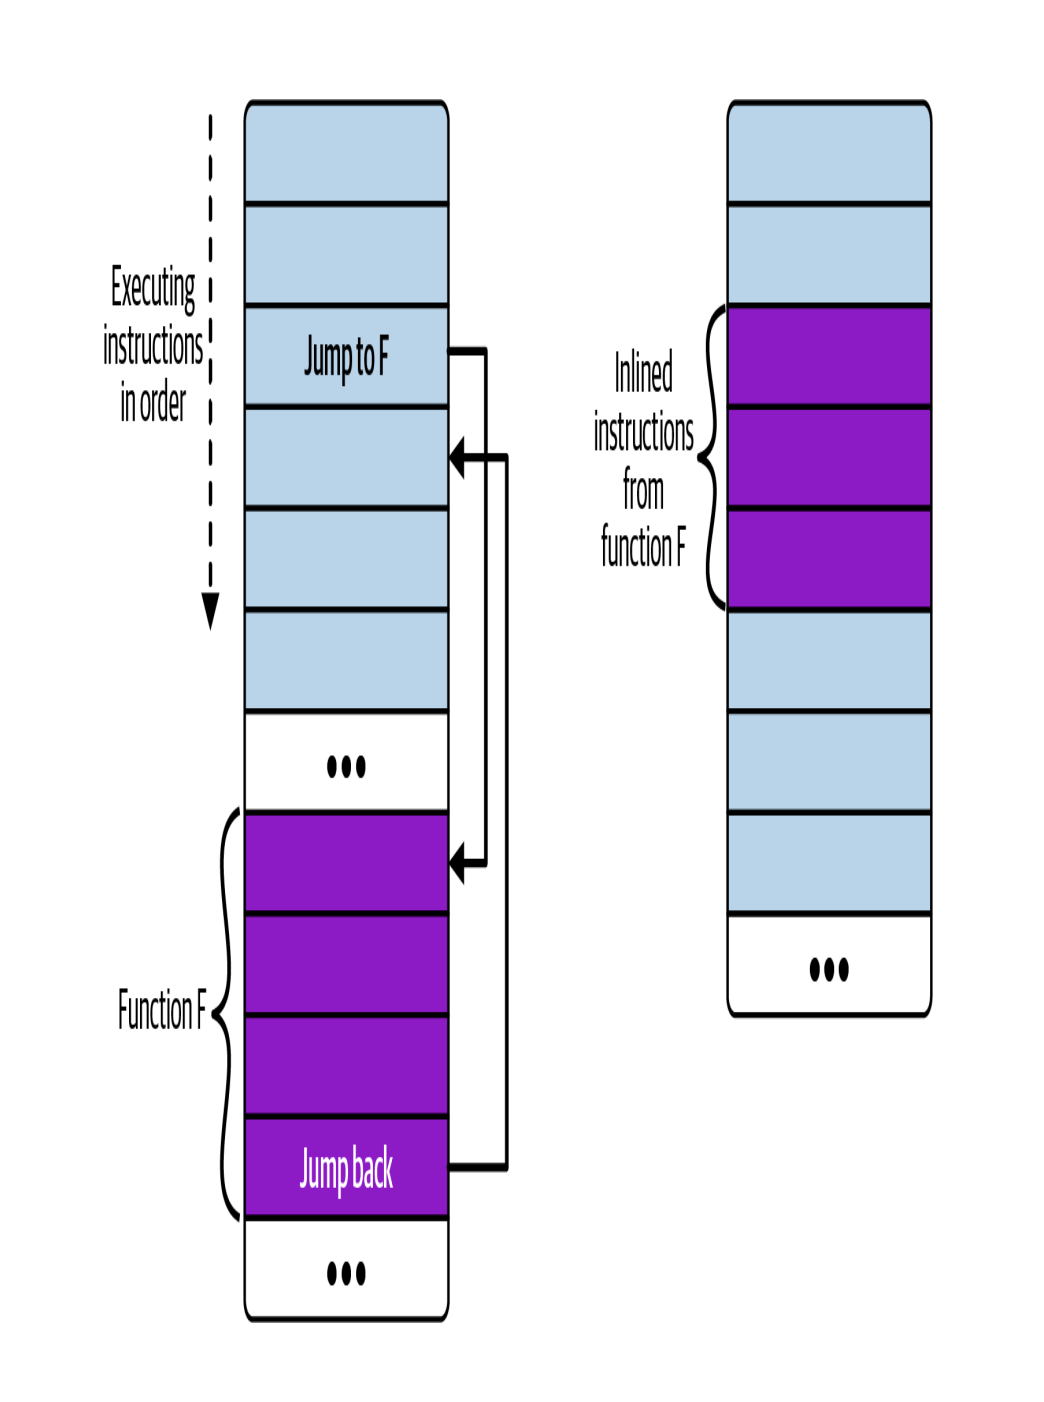
If the function is called from multiple places, that results in multiple copies of that function’s instructions in the compiled executable. (Sometimes the compiler might choose to inline a function for optimization purposes)
Tail calls
As described here at ebpf.io, the tails calls will jump to execute other eBPF program and replace the execution context, similar to how execve system call replaces the current process with a new one.
Now, Let's jump into the code like how can we implement tail calls in eBPF using rust.
// 1
#[map(name = "SYSCALL")]
static SYSCALL: ProgramArray = ProgramArray::with_max_entries(300, 0);

// 2
#[raw_tracepoint]
pub fn hello(ctx: RawTracePointContext) -> u32 {
    // 3
    let opcode = unsafe { get_opcode(&ctx) };
    unsafe {
        // 4
        // tail call is made here
        SYSCALL.tail_call(&ctx, opcode)?;
    }
    // 5
    // executes only if tail call failed
    info!(&ctx, "tail call failed");
    0
}

fn get_opcode(ctx: &RawTracePointContext) -> u32 {
    unsafe { (*ctx.as_ptr()).arga[1] as u32 }
}

// 6
#[raw_tracepoint]
pub fn hello_execve(ctx: RawTracePointContext) -> u32 {
    info!(&ctx, "Executing a program");
    0
}

// 7
#[raw_tracepoint]
pub fn hello_timer(ctx: RawTracePointContext) -> u32 {
    let opcode = unsafe { (*ctx.as_ptr()).args[1] as u32 };

    let msg = match opcode {
        222 => " Creating a timer",
        226 => "Deleting the timer",
        _ => "Some other timer operations",
    };
    info!(&ctx, msg);
    0
}

// 8
#[raw_tracepoint]
pub fn ingnore_opcode(ctx: RawTracePointContext) -> u32 {
    0
}
Now let's go throught the every line of code here point by point
1 -> SYSCALL is a program array to store the syscalls the program makes.
NOTE: Linux contains almost 300 syscalls
2 -> Using the macro #[raw_tracepoint] to define a raw tracepoint function. so that we can attach this program to the tracepoint sys_enter.
3 -> As we are attaching the program to the tracepoint sys_enter, we need to get the opcode of the syscall from the context. based on the opcodes we can ignore the syscall or execute the syscall.
4 -> Here we make the tail call to the entry in the program array whose matches to the opcode.
5 -> If the tail call fails, we execute the syscall. if the tail call succeeds, we ignore this line.
6 -> hello_execve is a program that will be added to the program array SYSCALL. when the opcode indicates it's an execve() syscall.
7 -> hello_timer is another program that will be added to the program array SYSCALL. when the opcode indicates it's a timer operation.
8 -> ignore_opcode is a tail program that does nothing. we use this syscall when we don't want any traces to be generated.
Now let's move to the user space and let's see how we call these:
    // 1
    let hello: &mut RawTracePoint = ebpf.program_mut("hello").unwrap().try_into()?;
    hello.load()?;
    hello.attach("sys_enter");

    // 2
    let execve: &mut ProgramFd = ebpf.program_mut("hello_execve").unwrap().try_into()?;
    execve.load()?
    let timer: &mut ProgramFd = ebpf.program_mut("hello_timer").unwrap().try_into()?;
    timer.load()?;
    let ignore: &mut ProgramFd = ebpf.program_mut("ignore_opcode").unwrap().try_into()?;
    ignore.load()?;

    // 3
    let mut syscall_map = ProgramArray::try_from(ebpf.map_mut("SYSCALL")?)?;

    // 4
    syscall_map.set(59, execve, 0);
    syscall_map.set(222, timer, 0);
    syscall_map.set(226, timer, 0);

    syscall_map.set(21, ignore, 0);
    syscall_map.set(22, ignore, 0);

    // 5
    aya_log::EbpfLogger::init(&mut ebpf);
Let's go point to point and understand what each line does:
1 -> Here Instead of attaching to the kprobe, this time we attach programs to the the sys_enter tracepoint.
2 -> Here we are just calling the and loading the programs and not attaching them to any tracepoint.
3 -> The user space code creates entries in the syscall_map. The map doesn't need to be filled with all the syscalls. if the opcode is empty then the tail call will be ignored.
4 -> Based on the opcode we get from the syscall_map, we call the appropriate program.
5 -> Print the trace outputs on the screen until user terminates the program.
Running this program will generates trace outputs for every syscall that runs on virtual machine, unless the opcode has an entry that links it to the ignore_opcode() tail call.
check this github repo here for the code
NOTE: Check out Paul Chaignon’s blog post about the cost of BPF tail calls on various different kernel versions.
Tail calls have been supported in eBPF since kernel version 4.2, but for a long time they were incompatible with making BPF to BPF function calls. This restriction was lifted in kernel 5.10.10
The fact that you can chain up to 33 tail calls together, combined with the instruction complexity limit per eBPF program of 1 million instructions, means that today’s eBPF programmers have a lot of leeway to write very complex code to run entirely in the kernel.
Summary
I hope that by showing some concrete examples of an eBPF program, this chapter helped you consolidate your mental model of eBPF code running in the kernel, triggered by events. You’ve also seen examples of data being passed from the kernel to user space using BPF maps.